LiteCommerce:EcommerceReports
|
The LiteCommerce Ecommerce Reports add-on module is an extremely flexible tool created to help you perform targeted searches of different kinds of store data and gather information about various aspects of your LiteCommerce online store functioning. The module allows you to get the data which is of vital importance to any e-commerce business: you can turn to any period in the history of your store and find out how many orders of different statuses existed at the time, what the number of active members accounts and the number of accounts registered during the period was, which of your products were sold the most, how the dynamics of sales changed during the period, where the customers who purchased products at your store came from, what payment/shipping methods were the most popular, which of your customers purchased products from this or that category, and much more.
Contents
Operating the module
The module does not need to be configured. To access the functionality provided by the module in the Administrator Zone go to the 'Ecommerce reports' section of the 'Maintenance' menu.
There are six tabs here, with corresponding report groups:
- General Statistics;
- Product Sales;
- Sales Dynamics;
- Sales By Geography;
- Shipping/Payment Stats;
- Focused Audience.
You can switch between the sections by selecting the corresponding tabs at the top of the screen.
General Statistics
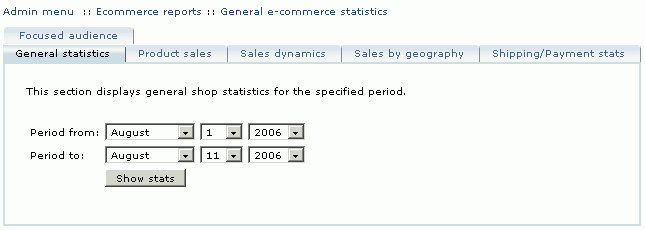
This section displays general shop statistics for the specified period.
Specify the period by setting the period start and end dates and click 'Show stats'.
The statistic data which are shown are self-explanatory.
The following data are included:
- the total number of orders placed at your store during the chosen period (with specified data on the order statuses),
- gross subtotal of all the orders in the period (the sum of subtotal amounts of all the orders),
- total tax (the sum of all the taxes applied to the orders),
- shipping charges (the summarized cost of shipping of all the orders),
- the total sum of discounts applied to the orders (with detailing of the amounts falling to the parts of different kinds of discounts),
- gross total sales amount (the sum of total amounts of all the orders),
- the number of active members accounts (number of store user accounts which are currently enabled),
- the number of new member'’'s accounts (accounts registered during the specified period).
Product Sales
The ‘Product sales’ section allows you to get information about the products sold by your store during a certain period. You can get statistics on products from one specific category, several categories or all the categories in your store.
To get statistical data on the products of some category/categories sold in some period, do the following:
1. Select report period.
2. Select the categories you want to include into the search results.
3. Select 'Quantity' or 'Total' in the 'Sort by' select-box.
4. Click 'Search'.
Example 1.
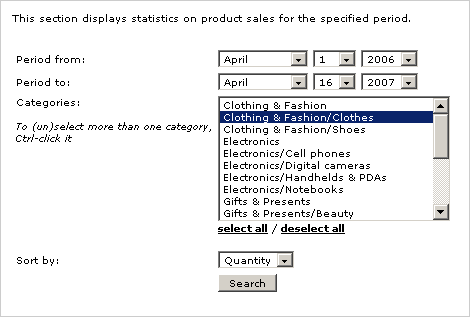
You want to find out, how many products from the category ‘Clothing & Fashion/Clothes’ were sold from April 1, 2006 till April 16, 2007. Take the following steps:
1. Specify the beginning and the end of the period: April 1, 2006 and April 16, 2007.
2. In the ‘Categories’ field select ‘Clothing & Fashion/Clothes’.
3. Leave the ‘Split by product options’ check box empty (applies only if you have ProductOptions enabled).
4. To sort the search results by the quantity of sold products, select ‘Quantity’ in the ‘Sort by’ select box.
5. Click 'Search'.
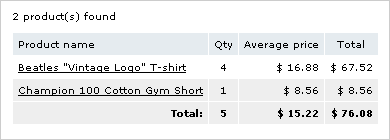
The results of this search query will look something like this:
Sales Dynamics
This section displays statistics on sales for the specified period. You can get a graphic presentation of information about the summarized cost of products purchased during this period, the quantity of items purchased and the number of orders placed in this period with “Processed” or “Complete” status. You can get statistics on sales within a specific category, a group of categories or all the categories in the store, and even trace the dynamics of how a specific product was sold.
The application performs a search based on the parameters specified in the form and produces a graph which can be used for quick evaluation of the store sales dynamics. The necessary degree of accuracy of the graph can be set by selecting the step (day, week, month, quarter, year). The search results can also be exported to MS Excel where a more accurate graph can be built. Export to MS Excel gives you the advantage of being able to choose the form of the graphical presentation of your data.
To get the application to produce a graphical presentation of sales dynamics in the ‘Sales dynamics’ section, do the following:
1. Select the period.
2. Select the step you want to use to break down the results: day, month, week, quarter, year.
3. Select the categories you want to include into the search results.
4. Click 'Select product' and use the standard product search forum to choose the necessary one. When you have selected a product, you can click 'Clear' to remove it from search parameters.
5. Select which data you want to see: the total for all the sold items of the product; the quantity or the number of orders.
6. Click 'Search' to show the results or 'Export to MS Excel' to view or save an .xls file containing the sales dynamics.
Click 'Clear form' to delete all the search parameters.
Example.
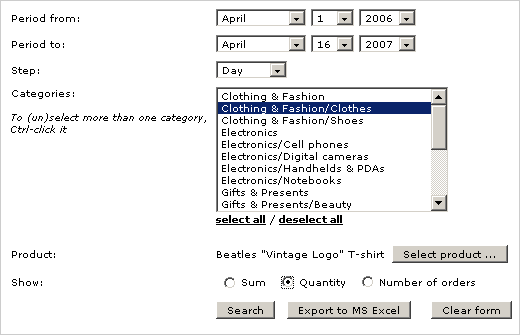
You want to trace the dynamics of the number of orders placed at your store in the period April 1, 2006 – April 16, 2007 which are now processed / completed. Take the following steps:
1. Specify the beginning of the period: April - 1 - 2006.
2. Specify the end of the period: April - 16 - 2007.
3. Select the step for your graph (For example, Day)
4. As you are interested in all the sales made at your store, click on the ‘select all’ link to select all the categories. Do not use the 'Select product' button.
5. In the ‘Show’ line select the radio button next to 'Number of orders'.
6. Click 'Search'.
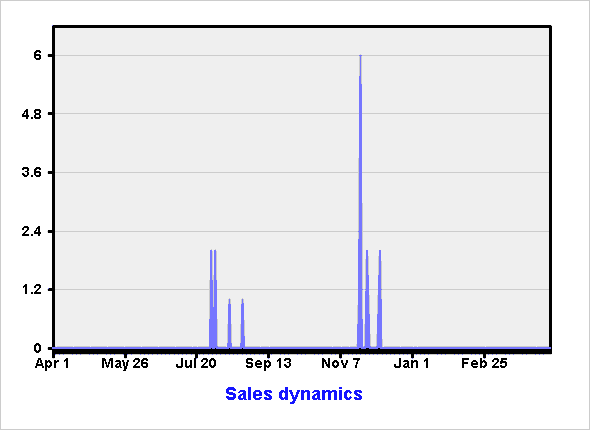
The results displayed to you will look like this:
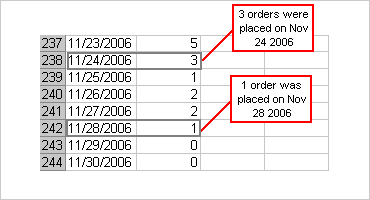
Exporting the search results data to MS Excel, you get a file with a list of dates and the indication of the number of orders placed each day:
Sales By Geography
The ‘Sales by geography’ section allows you to get information about the geography of your sales. Namely, you can find out, what products from this or that category (or the whole store) were purchased by the customers coming from a certain location, how many items of each product were purchased and what the total sum of purchases was. According to your needs, information about your customers’ location can be gathered from either billing or shipping address provided in the order.
To get information about the purchases made by the customers coming from a certain location, do the following:
1. Select the period.
2. Select the categories you want to include into the search results.
3. Select which address to use - shipping or billing.
4. Select countries and states to be included into the report.
5. Select 'Quantity' or 'Total' to sort by.
6. Click 'Search'.
Example.
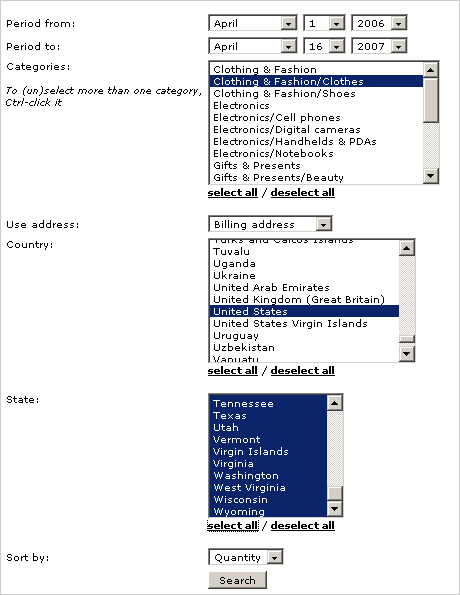
You want to know how many purchases were made at your store in the period April 1, 2006 – April 16, 2007 by residents of USA (You want the search to be based on the billing address). Do the following:
1. Specify the beginning of the period: April 1, 2006.
2. Specify the end of the period: April 16, 2007.
3. As you are interested in all the sales made at your store, click on the ‘check all’ link to select all the categories.
4. Select United States in the field ‘Country’.
5. Select the ‘Split by product options’ check box for product variants to be displayed on separate lines.
6. Select Total in the ‘Sort by’ select box for the search results to be sorted by the total amount.
7. Click on 'Search'.
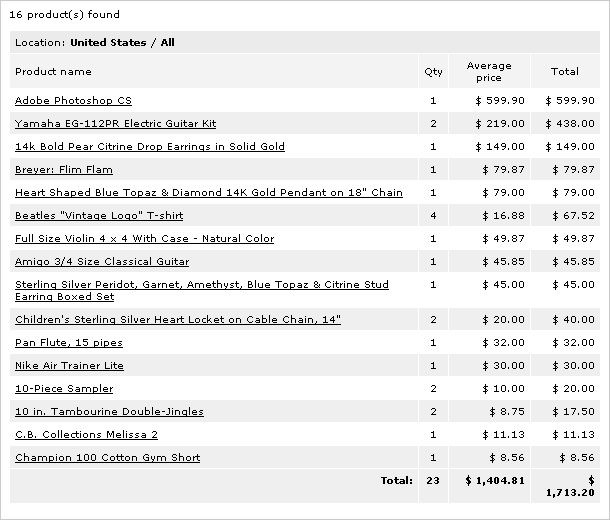
The results displayed to you will look something like this:
If you want to find out how many purchases were made in the same period by residents of just one American state, California, set the search parameters exactly as in the example above, but select California in the field ‘State’ (in addition to United States selected in the field ‘Country’).
Shipping/Payment Stats
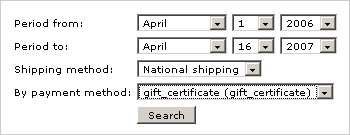
The ‘Shipping/Payment stats’ section allows you to single out various types of orders based on the used shipping or payment method (or their combination) and to find out statistical data about these order types (for example, how many orders of each type were placed during some period, what the total amount of the orders of a specific type is, and how many percent of all the orders fall to the part of this or that type).
To view statistics based on the shipping/payment methods used in the orders, do the following:
1. Select report period.
2. Specify the shipping method (‘Shipping method’ select box). Only the shipping methods actually used in the orders appear in the drop-down list. Select All if the shipping method is not important.
3. Specify the payment method (‘By payment method’ select box). Only the payment methods actually used in the orders appear in the drop-down list. Select All if the payment method is not important.
4. Click 'Search'.
Example
You want to find out how many orders placed in the period April 1, 2006 – April 16, 2007 used ‘National shipping’ shipping method and ‘Phone ordering’ payment method. Do the following:
1. Specify the beginning of the period: April - 1 - 2006.
2. Specify the end of the period: April - 16 - 2007.
3. In the ‘Shipping method’ select box, select National shipping.
4. In the ‘By payment method’ select box, select Phone Ordering.
5. Click 'Search'.
The results displayed to you will look like this:
[Image:lc-er-14.gif|center|
]]
Eighteen orders with the combination ‘National shipping + Phone ordering’ were placed at the store during the specified period, the total amount of these orders is $1,381.08, and they make 75% of the total number of currently processed/completed orders which were placed during this period.
Focused Audience
The ‘Focused audience’ section allows you to find store users by certain marketing criteria, send newsletters to their e-mail addresses and export information about the found users to a CSV file. For example, you can find users who purchased certain products (you can specify up to 3 products per one search and for each of these products set additional conditions concerning the number of items purchased), users who purchased products from a specific category (or categories), users from a particular location, users who paid for their orders by a particular gift certificate, users who purchased products for a sum that is more than/less than/equal to a certain amount, etc.
To search for users:
1. Specify the beginning of the period (‘Period from’ line).
2. Specify the end of the period (‘Period to’ line).
3. Select either all or any from the select box in the ‘Match: all/any of selected products and categories’ line.
4. (Optional) Select 1-3 products which were bought by the users you are searching for (‘Purchased products’ section).
To select a product click on the 'Select product' button and use the standard product search form to find the necessary one.
5. (Optional) Specify the number of items of the selected product(s) in one order:
a. Use the select box ‘Select one…’ opposite the name of the product to select More than, Less than or Equal.
b. Enter the number of items into the input box next to it.
(All the users, who placed at least one order with the number of items of the selected product specified in this field, will be found. For example, to find all the users whose order contains 3 items of the product, select ‘Equal’ + ‘3’. To find all the users whose order contains more than 10 items of the product, select ‘More than’ + ‘10’).
6. If necessary, select the categories in which purchases were made by the users you are searching for (‘Purchased products from categories’ section).
7. Target your search by location:
a. Choose by which information you want to define the location of your customers (‘Search by location’ line): select Billing information, Shipping information or Both.
b. Specify the city which the customers come from, select a state and a country.
8. Specify what the total of a customer’s purchases must be:
Select More than, Less than or Equal and enter the amount, with which the total of a customer’s purchases must be compared, into the input box next to it.
9. Specify what the number of a customer’s orders must be (‘Number of orders’ line):
Select More than, Less than or Equal and enter the number, with which the number of a customer’s orders must be compared, into the input box next to it.
(For example, to find all the users who placed more than 10 orders which are now processed/completed, select ‘More than’ + ‘10’. To find all the users with the number of orders equal to 3, select ‘Equal’ + ’3’).
10. If necessary, enter the ID of the gift certificate which was used by the customers to pay for the products purchased at your store (‘Used gift certificate’ input box).
11. Select the membership level to which the customers being searched for belong (‘Membership’ select box).
12. Click 'Search'.
The names of users found by the search query are displayed in the form of a list along with the user’s email addresses.
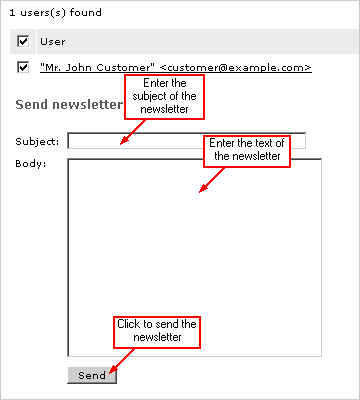
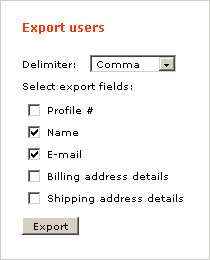
If at least one user is found, 2 sections appear below the list of search results: ‘Send newsletter’ and ‘Export users’.
- Sending a newsletter
The ‘Send newsletter’ section can be used to send a message to all or some of the users in the search results list.
1. Enter the subject of your message (‘Subject’ field)
2. Enter the text of your message (‘Body’ field)
3. Click 'Send'.
- Exporting Users
The ‘Export users’ section can be used to export information about the found users to a CSV file:
1. Select a delimiter which you want to be used in the CSV file (semicolon, comma, tab)
2. Specify what kind of data you want to be exported into the CSV file by selecting the check boxes next to the names of the corresponding export fields.
3. Click 'Export'.
4. Save the file.
