X-Cart:Advanced Statistics
Contents
Overview
The Advanced Statistics module enables the Shop statistics and Tracking statistics functionality at your store.
Roles:
If you are an X-Cart GOLD or GOLD PLUS administrator/provider or an X-Cart PLATINUM or PRO administrator, you can:
- Enable/disable and configure the Advanced Statistics module (See Enabling and Configuring).
- View your Shop statistics for your store (See Understanding Shop Statistics).
- View your Tracking statistics for your store (See Understanding Tracking Statistics).
If you are an X-Cart PLATINUM or PRO provider, you cannot view statistics.
Enabling and Configuring
Advanced Statistics is available as a built-in module in all X-Cart editions (GOLD, GOLD PLUS, PRO, PLATINUM and ENTERPRISE).
To begin using the module:
1. Enable the Advanced Statistics module by selecting Advanced Statistics on the Modules page, which can be accessed by selecting Settings -> Modules on the Administrator's menu.
2. Adjust the module's settings by clicking on the Configure link by the Advanced Statistics item on the Modules page:
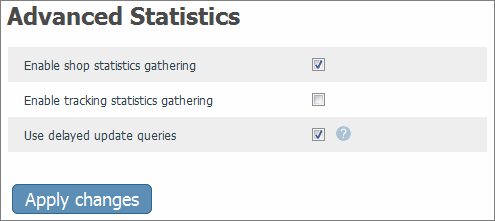
- Enable shop statistics gathering: Enables gathering statistics for your online store.
- Enable tracking statistics gathering: Enables gathering tracking statistics.
- Use delayed update queries: Allows slight delays in gathering statistics for optimizing the overall performance of the store. May cause slight delays on the admin area's statistics page, caused by carrying out the delayed queries.
3. Click the Save button to save the changes.
Understanding Shop Statistics
To view Shop Statistics:
1. Sign in to the Admin area of your X-Cart based store.
2. On the Tools menu, select Statistics and then click on the Shop statistics link on the side menu.
The 'Shop statistics' page allows you to find out statistics on category views, product views, product sales, products removed by customers from the shopping cart and referrer statistics.
The 'Category views' section provides information on what categories in your store were viewed most often during the period specified on the 'Date setting' form. On the left side of the section, you can see category names; on the right side, there is a graph showing the number of views taken place for the respective category.
By clicking on the category names you can view statistics on the respective subcategories and products. Click on a category name to get the list of its subcategories. You can always find out which level of the category tree you are at and move between the levels of your category tree using the navigation bar at the top of the 'Category views' section.
Click on a subcategory name to see which products inside the subcategory were viewed during the specified period, and how many times each of the products has been viewed (a product is considered 'viewed' if customer has clicked on its 'See details' link). Clicking on a product name in the 'Product views' section shows the respective product details.
The 'Product sales' section shows how many products have actually been sold during the specified period (a product is considered 'sold' when the order that includes this product gets the 'processed' status).
The 'Deleted from the cart' section shows how many times each of the products listed here has been deleted from customer's shopping cart after being placed in it.
The 'Referrer statistics' section shows which websites referred visitors to your store most effectively.
Understanding Tracking Statistics
Your store's tracking statistics includes the following types of statistic data:
- Top paths through site
- Top page views
- Shopping cart conversion funnel
Top paths through site
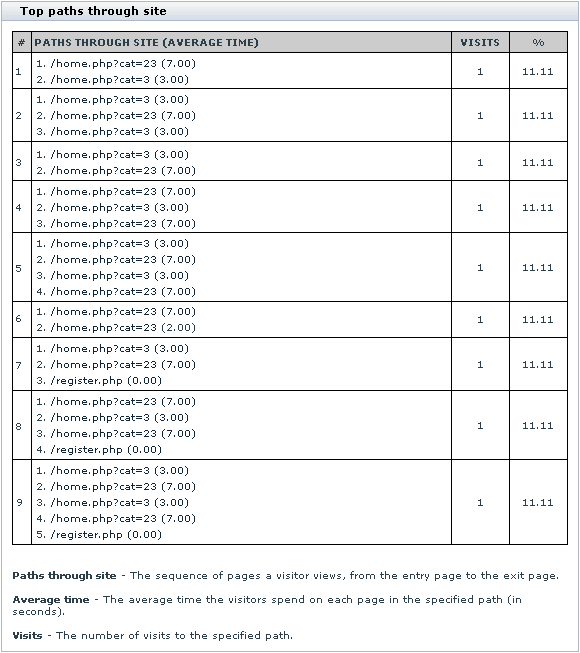
The 'Top Paths Through Site' section enables you to view the paths your visitors took through your site during the past period. A 'path' is a succession of pages customer visits from the moment of entry to the store to the moment of leaving. The value in the brackets shows the average time (in seconds) spent by your visitors on a separate page within the path. The number in the VISITS column shows how many times the path has been taken by your visitors. The last column shows the share a certain path in the total number of visits.
You can view any page in a path by clicking on its URL.
Top page views
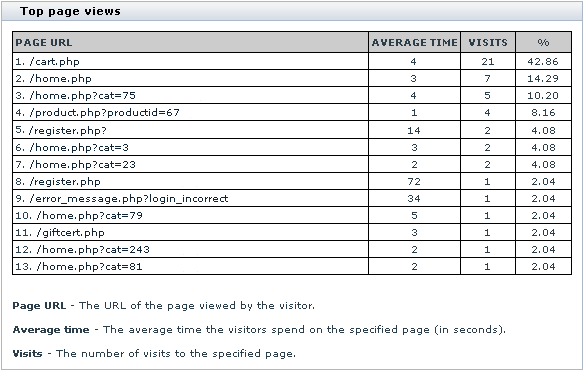
The 'Top Pages Views' section shows the pages your customers visited during the past period. The PAGE URL column shows the URLs of the pages viewed by your customers. The AVERAGE TIME column shows the average time (in seconds) spent by your visitors on the respective page. The number in the VISITS column shows how many times the page has been viewed by your visitors. The last column shows the share a certain page in the total number of visits.
You can view any page by clicking on its URL.
Shopping cart conversion funnel
The 'Shopping cart conversion funnel' is one of the most powerful tools that can help you evaluate the efficiency of your store. Knowing how many visitors your store gets over a certain time span does not give you much of benefit in the sense that you do not know how efficient those visits are. In other words, who cares how many thousands of visitors you get per month if none of them ever buys anything?
This section helps you evaluate how successfully your visitors make it through the process of buying products at your store.
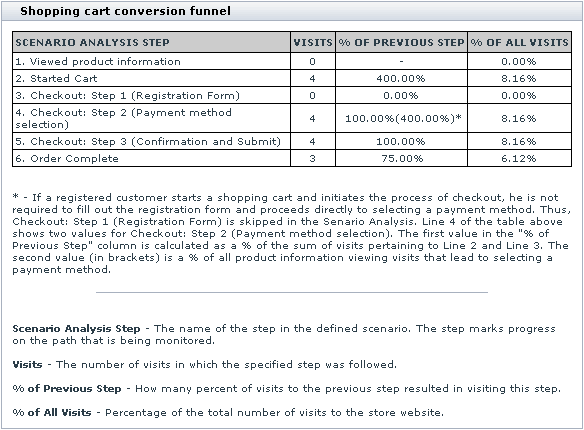
We singled out a few steps that customer needs to take before his order gets placed and completed (they are listed in the first column of the 'Shopping Cart Conversion Funnel' table).
First, he needs to view product info and decide what he wants to buy ('Viewed product information').
Second, he needs to start a shopping cart: to put a product into his cart, to decide on the quantity, color, size, etc. of the product that he wants to buy and select a delivery method ('Started Cart').
Third, he needs to begin the checkout process. This third step makes all the difference between registered and non-registered users. When a non-registered user initiates the checkout process, he is required to fill out the registration form (otherwise you would not know where to ship the ordered product). If a user is registered, you already have his address and contact info, so he skips the step of filling out the registration form and can proceed to selecting a payment method. If you refer to the table below, you will find out that registered users start the checkout directly from the fourth step of our scenario analysis ('Checkout: Step 2'), while non-registered users have to go through both third ('Checkout: Step 1') and fourth ('Checkout: Step 2') steps.
On the fifth step ('Checkout: Step 3') all the users that got this far have to confirm their payment details and submit the order. This brings them to the sixth step ('Order Complete') after they have placed their order successfully (order status is set to "Processed" or "Queued").
The VISITS column of the 'Shopping Cart Conversion Funnel' table allows you to see how many visits to each of the enumerated steps took place. % OF PREVIOUS STEP column shows how many percent of the visits to the previous step resulted in visiting this step (in other words, how many visitors got here from the previous step - in percent). % OF ALL VISITS column shows the share of a certain step in the total number of visits.
Video tutorial


